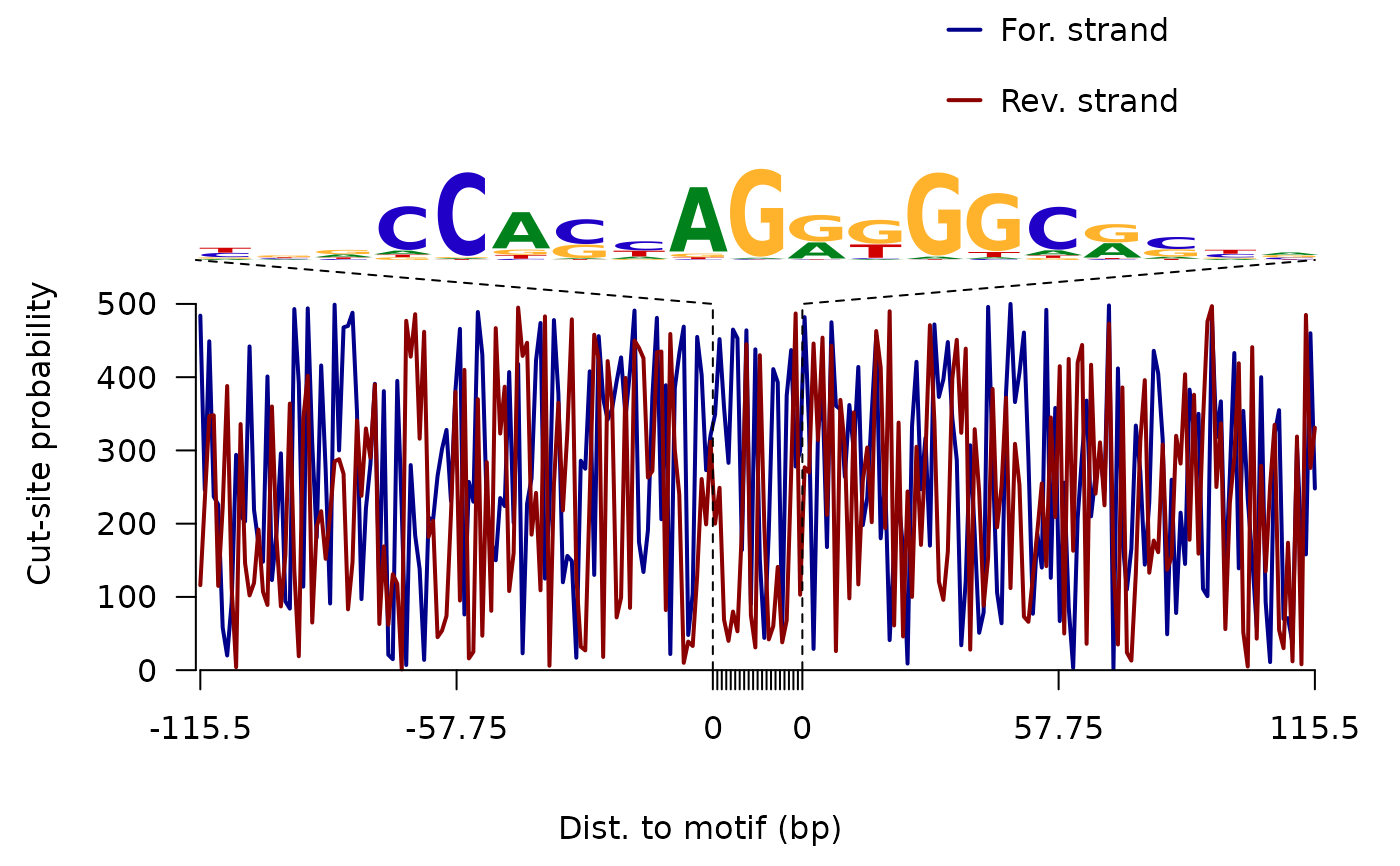
Plots a footprint estimated by Centipede
plotFootprints.RdVisualizing the footprint profile
plotFootprints(
  Profile,
  Mlen = 0,
  xlab = "Dist. to motif (bp)",
  ylab = "Cut-site probability",
  legLabels = c("For. strand", "Rev. strand"),
  legTitle,
  xlim,
  ylim,
  newpage = TRUE,
  motif,
  segmentation
)
Arguments
| Profile | A vector with the profile estimated by CENTIPEDE |
|---|---|
| Mlen | Length of the motif for drawing vertical lines delimiting it |
| xlab | Label of the x axis |
| ylab | Label for the y axis |
| legLabels | Labels for legend. |
| legTitle | Title for one of the plot corners |
| xlim | xlim |
| ylim | ylim |
| newpage | Plot the figure in a new page? |
| motif | a pfm object. |
| segmentation | the segmentation position and abundance |
Value
Null.
Author
Jianhong Ou
Examples
library(MotifDb)
CTCF <- query(MotifDb, c("CTCF"))
CTCF <- as.list(CTCF)
motif <- new("pfm", mat=CTCF[[1]], name="CTCF")
ATACseqQC:::plotFootprints(Profile=sample.int(500),
                        Mlen=ncol(CTCF[[1]]), motif=motif)