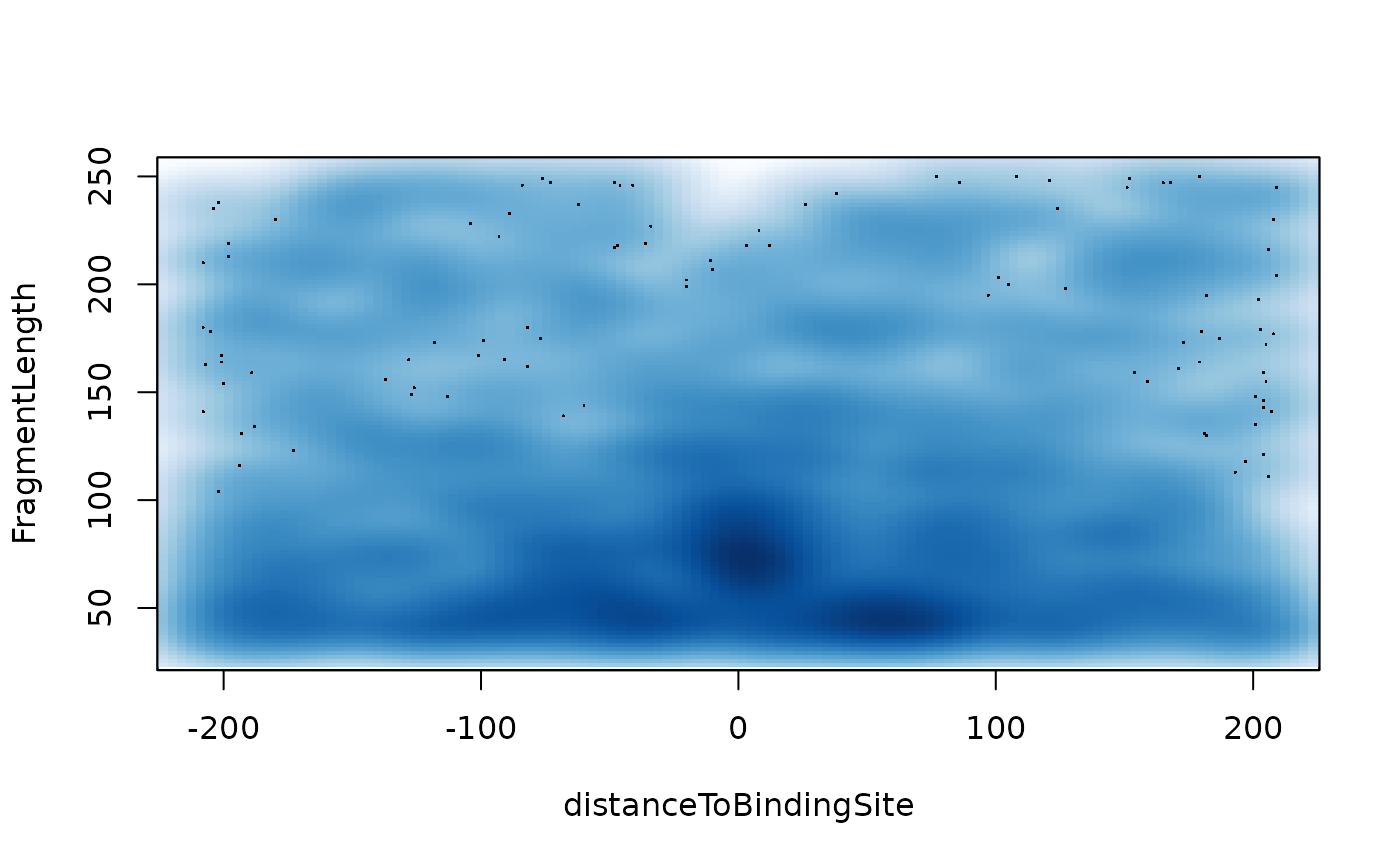
V-plot
vPlot.RdAggregate ATAC-seq Fragment Midpoint vs. Length for a given motif generated over binding sites within the genome.
vPlot(
  bamfiles,
  index = bamfiles,
  pfm,
  genome,
  min.score = "95%",
  bindingSites,
  seqlev = paste0("chr", c(1:22, "X", "Y")),
  upstream = 200,
  downstream = 200,
  maxSiteNum = 1e+06,
  draw = TRUE,
  ...
)
Arguments
| bamfiles | A vector of characters indicates the file names of bams. All the bamfiles will be pulled together. |
|---|---|
| index | The names of the index file of the 'BAM' file being processed; This is given without the '.bai' extension. |
| pfm | A Position frequency Matrix represented as a numeric matrix with row names A, C, G and T. |
| genome | An object of BSgenome. |
| min.score | The minimum score for counting a match. Can be given as a character string containing a percentage (e.g. "95 score or as a single number. See matchPWM. |
| bindingSites | A object of GRanges indicates candidate binding sites (eg. the output of fimo). |
| seqlev | A vector of characters indicates the sequence levels. |
| upstream, downstream | numeric(1) or integer(1). Upstream and downstream of the binding region for aggregate ATAC-seq footprint. |
| maxSiteNum | numeric(1). Maximal number of predicted binding sites. if predicted binding sites is more than this number, top maxSiteNum binding sites will be used. |
| draw | Plot or not. Default TRUE. |
| ... | parameters could be used by smoothScatter |
Value
an invisible data.frame for plot.
References
Jorja G. Henikoff, Jason A. Belsky, Kristina Krassovsky, David M. MacAlpine, and Steven Henikoff. Epigenome characterization at single base-pair resolution. PNAS 2011 108 (45) 18318-18323
Author
Jianhong Ou
Examples
bamfile <- system.file("extdata", "GL1.bam",
                       package="ATACseqQC")
library(MotifDb)
CTCF <- query(MotifDb, c("CTCF"))
CTCF <- as.list(CTCF)
library(BSgenome.Hsapiens.UCSC.hg19)
vPlot(bamfile, pfm=CTCF[[1]],
     genome=Hsapiens,
     min.score="95%", seqlev="chr1",
     ylim=c(30, 250))