Creates sunburst diagram using ggplot2.
ggSunburst(
  plotdata,
  fontsize = 1,
  rotate90 = NULL,
  maxCharacters = 30,
  legendTitle = "color",
  start = 0,
  end = NULL,
  clip = "off",
  expand = FALSE,
  ...
)
Arguments
- plotdata
A data.frame.
- fontsize
Default fontsize.
- rotate90
Rotate the labels 90 degree or not. Default NULL will try to auto rotate the labels according the space.
- maxCharacters
Maximal number of characters for labels
- legendTitle
The title of the legend.
- start, end
Offset of starting or ending point from 12 o'clock in radians. see coord_radial.
- clip
Should drawing be clipped to the extent of the plot panel? Default "on" means yes.
- expand
If TRUE, adds a small expansion factor the the limits to prevent overlap between data and axes. If FALSE, the default, limits are taken directly from the scale.
- ...
Other parameters (except theta) passed to coord_radial.
Value
A ggplot object
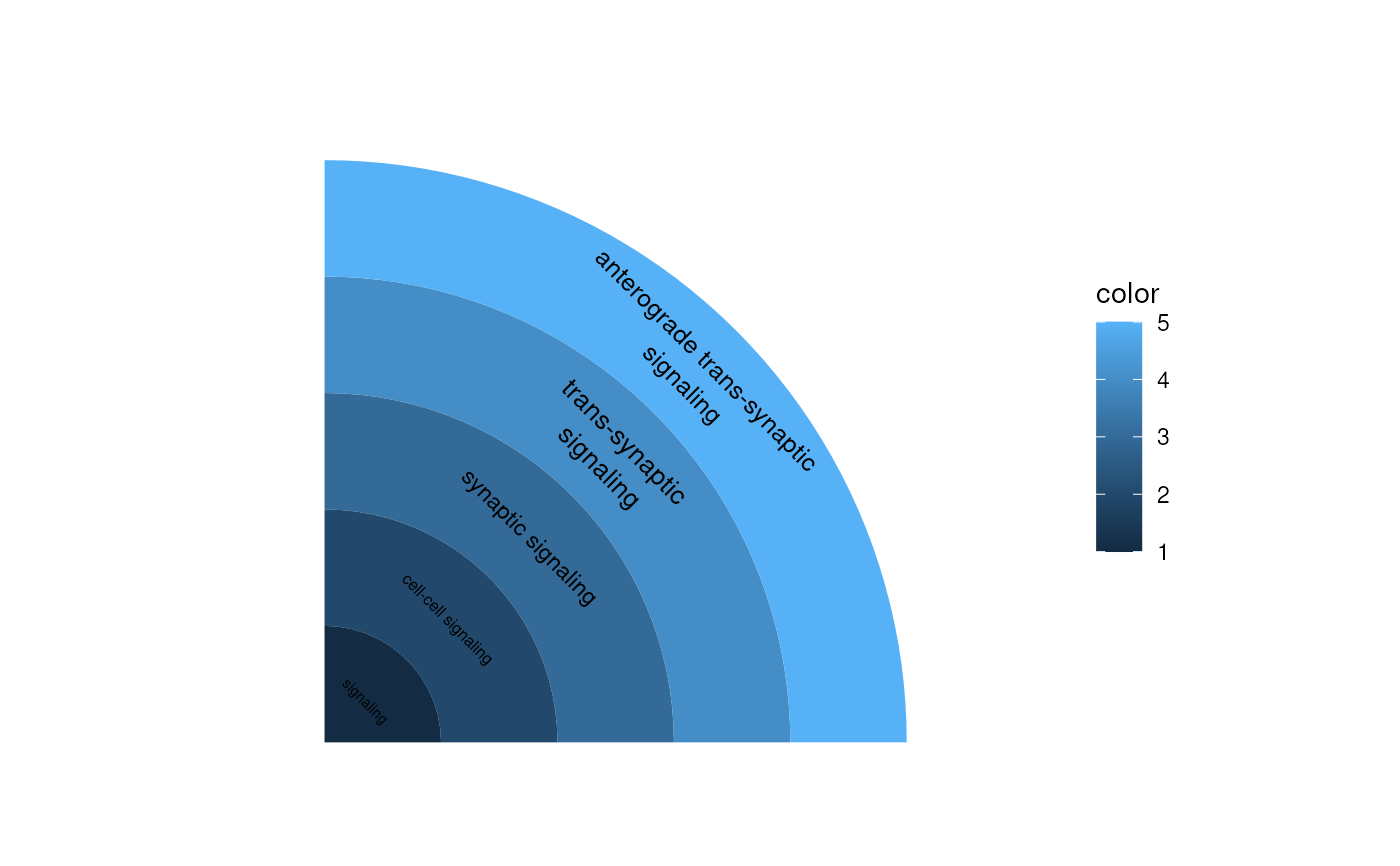
Examples
plotdata <- data.frame(
    id = c("GO:0023052", "GO:0007267", "GO:0099536", "GO:0099537", "GO:0098916"),
    x = 0.5,
    y = seq.int(5),
    xmin = 0,
    ymin = c(0.5, 1.5, 2.5, 3.5, 4.5),
    xmax = 1,
    ymax = c(1.5, 2.5, 3.5, 4.5, 5.5),
    fill = seq(1, 5),
    label = c(
        "signaling", "cell-cell signaling", "synaptic signaling",
        "trans-synaptic signaling", "anterograde trans-synaptic signaling"
    )
)
ggSunburst(plotdata, end = pi / 2)