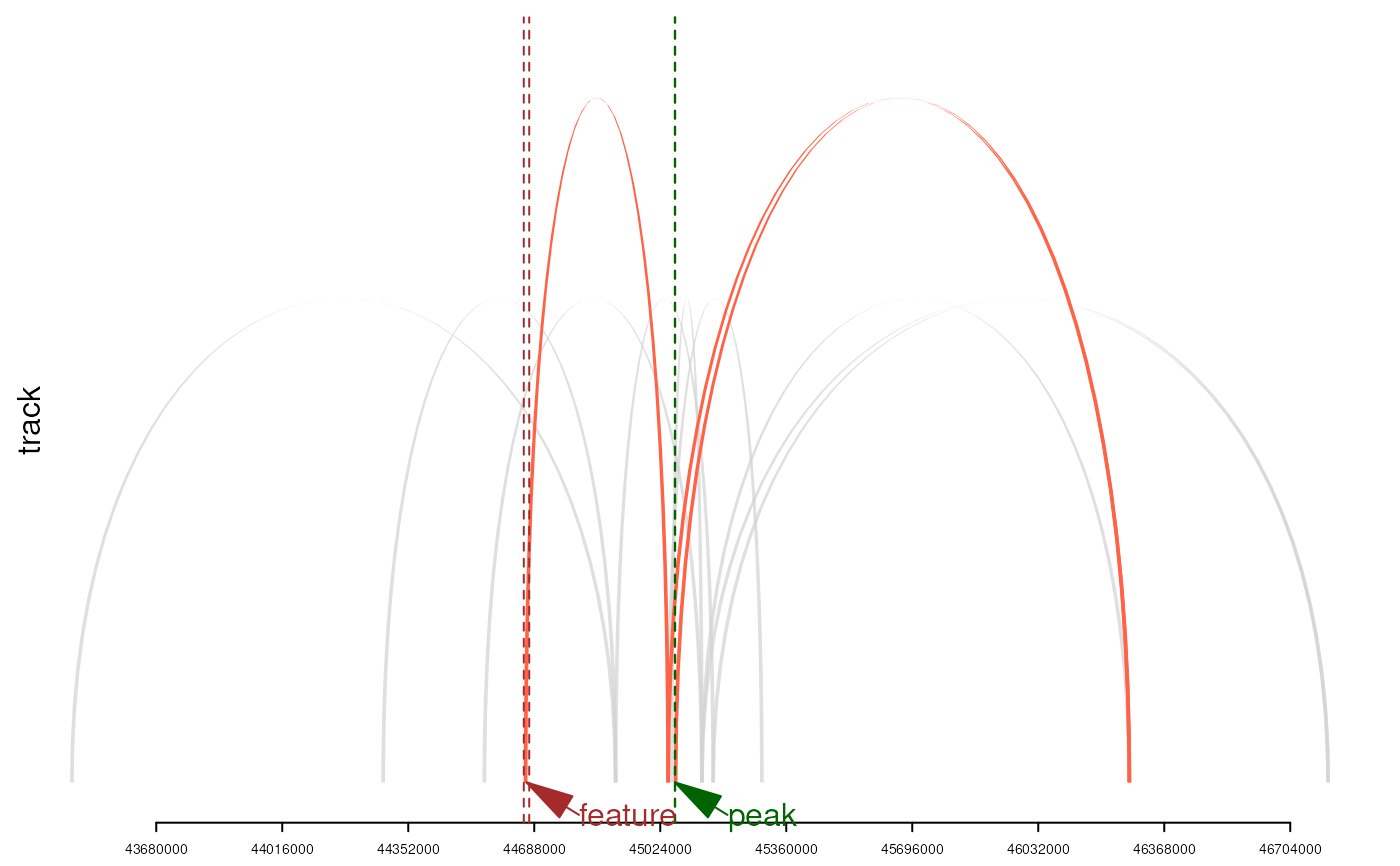
Plot interaction network for visualization
Arguments
- anno
An object of annoLinkerResult output by annoLinker
- event
Number to indicate the event to be plot
- output
Output of the plot.
- colors
Colors setting for the plot.
- txdb, org
The TxDb and OrgDb object used for annotation plot.
Value
htmlWidget or plots.
Examples
anno <- readRDS(system.file("extdata", "sample_res.rds",
package = "annoLinker"
))
library(org.Dr.eg.db)
#>
library(TxDb.Drerio.UCSC.danRer10.refGene)
n <- 1 # length(anno$annotated_peaks$evidences)
plotEvidence(anno,
event = n,
output = "htmlWidget"
)
plotEvidence(anno,
event = n,
output = "trackPlot"
)
 #> viewport[GRID.VP.9]