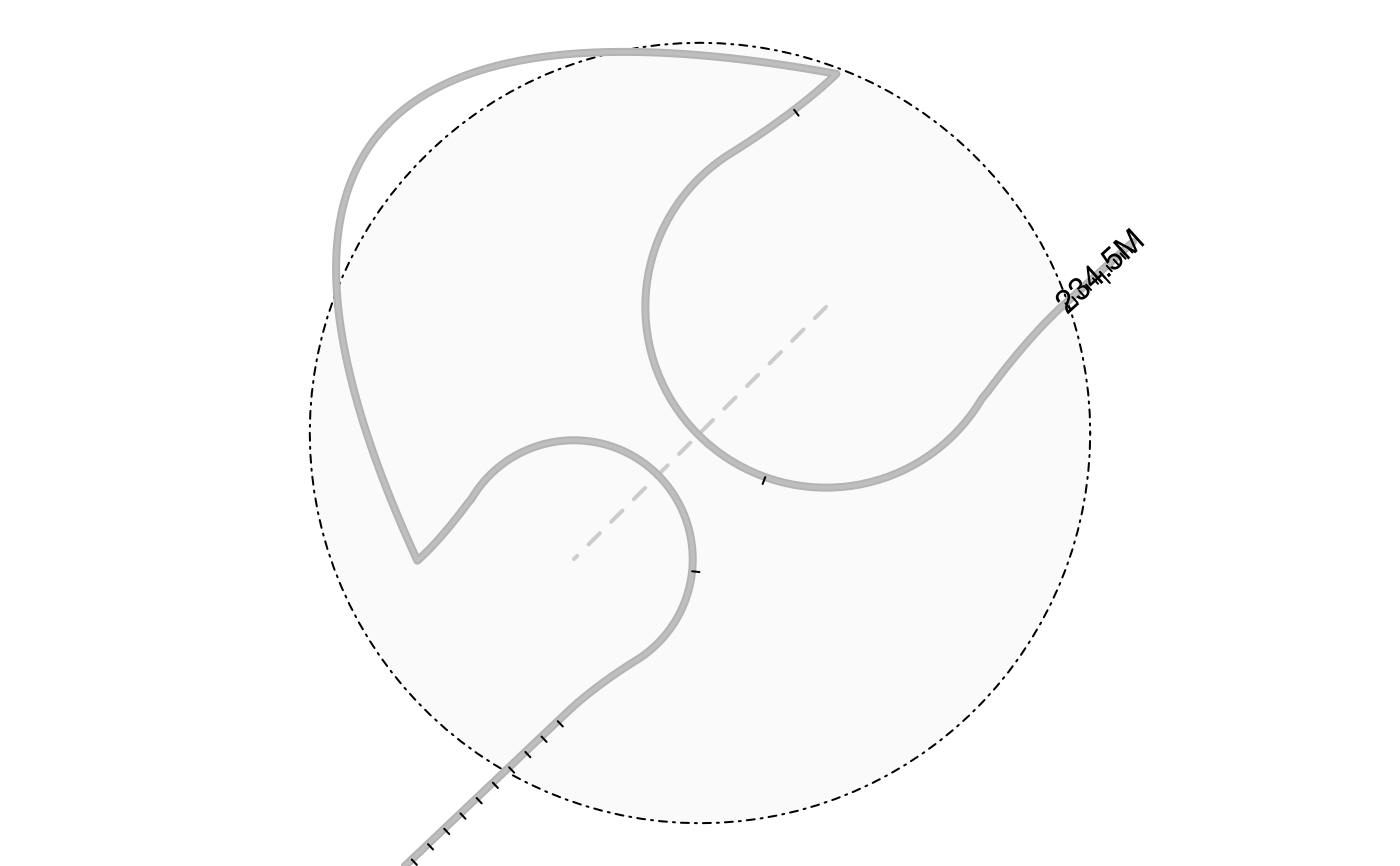
plot graph for GInteractions
loopBouquetPlot(
  gi,
  range,
  feature.gr,
  genomicSigs,
  signalTransformFun = function(x) {
     log2(x + 1)
 },
  label_region = FALSE,
  show_edges = TRUE,
  show_cluster = TRUE,
  lwd.backbone = 2,
  col.backbone = "gray",
  lwd.maxGenomicSigs = 8,
  reverseGenomicSigs = TRUE,
  col.backbone_background = "gray70",
  alpha.backbone_background = 0.5,
  lwd.gene = 2,
  lwd.nodeCircle = 1,
  col.nodeCircle = "#DDDDDD25",
  lwd.edge = 2,
  col.edge = "gray80",
  coor_mark_interval = 1e+05,
  col.coor = "black",
  show_coor = TRUE,
  coor_tick_unit = 1000,
  label_gene = TRUE,
  col.tension_line = "black",
  lwd.tension_line = 1,
  length.arrow = NULL,
  safe_text_force = 3,
  method = 1,
  doReduce = FALSE,
  ...
)
Arguments
- gi
An object of GInteractions
- range
The region to plot. an object of GRanges
- feature.gr
The annotation features to be added. An object of GRanges.
- genomicSigs
The genomic signals. An object of GRanges with scores or an object of track.
- signalTransformFun
The transformation function for genomic signals.
- label_region
Label the region node or not.
- show_edges
Plot the interaction edges or not.
- show_cluster
Plot the cluster background or not.
- lwd.backbone, lwd.gene, lwd.nodeCircle, lwd.edge, lwd.tension_line, lwd.maxGenomicSigs
Line width for the linker, gene, interaction node circle, the dashed line of interaction edges, the tension line and the maximal reversed genomic signal.
- col.backbone, col.backbone_background, col.nodeCircle, col.edge, col.tension_line, col.coor
Color for the DNA chain, the compact DNA chain, the node circle, the linker, the tension line and the coordinates marker.
- reverseGenomicSigs
Plot the Genomic signals in reverse values.
- alpha.backbone_background
Alpha channel for transparency of backbone background.
- coor_mark_interval
The coordinates marker interval. Numeric(1). Set to 0 to turn it off. The default value 1e5 means show coordinates every 0.1M bp.
- show_coor
Show coordinates or not.
- coor_tick_unit
The bps for every ticks. Default is 1K.
- label_gene
Show gene symbol or not.
- length.arrow
Length of the edges of the arrow head (in inches).
- safe_text_force
The loops to avoid the text overlapping.
- method
Plot method. Could be 1 or 2.
- doReduce
Reduce the GInteractions or not.
- ...
Parameter will be passed to layout_with_fr.
Value
A invisible list with the key points of the plot.
Examples
library(InteractionSet)
#> Loading required package: SummarizedExperiment
#> Loading required package: MatrixGenerics
#> Loading required package: matrixStats
#>
#> Attaching package: 'MatrixGenerics'
#> The following objects are masked from 'package:matrixStats':
#>
#>     colAlls, colAnyNAs, colAnys, colAvgsPerRowSet, colCollapse,
#>     colCounts, colCummaxs, colCummins, colCumprods, colCumsums,
#>     colDiffs, colIQRDiffs, colIQRs, colLogSumExps, colMadDiffs,
#>     colMads, colMaxs, colMeans2, colMedians, colMins, colOrderStats,
#>     colProds, colQuantiles, colRanges, colRanks, colSdDiffs, colSds,
#>     colSums2, colTabulates, colVarDiffs, colVars, colWeightedMads,
#>     colWeightedMeans, colWeightedMedians, colWeightedSds,
#>     colWeightedVars, rowAlls, rowAnyNAs, rowAnys, rowAvgsPerColSet,
#>     rowCollapse, rowCounts, rowCummaxs, rowCummins, rowCumprods,
#>     rowCumsums, rowDiffs, rowIQRDiffs, rowIQRs, rowLogSumExps,
#>     rowMadDiffs, rowMads, rowMaxs, rowMeans2, rowMedians, rowMins,
#>     rowOrderStats, rowProds, rowQuantiles, rowRanges, rowRanks,
#>     rowSdDiffs, rowSds, rowSums2, rowTabulates, rowVarDiffs, rowVars,
#>     rowWeightedMads, rowWeightedMeans, rowWeightedMedians,
#>     rowWeightedSds, rowWeightedVars
#> Loading required package: Biobase
#> Welcome to Bioconductor
#>
#>     Vignettes contain introductory material; view with
#>     'browseVignettes()'. To cite Bioconductor, see
#>     'citation("Biobase")', and for packages 'citation("pkgname")'.
#>
#> Attaching package: 'Biobase'
#> The following object is masked from 'package:MatrixGenerics':
#>
#>     rowMedians
#> The following objects are masked from 'package:matrixStats':
#>
#>     anyMissing, rowMedians
gi <- readRDS(system.file("extdata", "gi.rds", package = "trackViewer"))
range <- GRanges("chr2", IRanges(234500000, 235000000))
library(TxDb.Hsapiens.UCSC.hg19.knownGene)
#> Loading required package: GenomicFeatures
#> Loading required package: AnnotationDbi
library(org.Hs.eg.db)
#>
feature.gr <- genes(TxDb.Hsapiens.UCSC.hg19.knownGene)
#>   24 genes were dropped because they have exons located on both strands of the
#>   same reference sequence or on more than one reference sequence, so cannot be
#>   represented by a single genomic range.
#>   Use 'single.strand.genes.only=FALSE' to get all the genes in a GRangesList
#>   object, or use suppressMessages() to suppress this message.
feature.gr <- subsetByOverlaps(feature.gr, range(regions(gi)))
symbols <- mget(feature.gr$gene_id, org.Hs.egSYMBOL, ifnotfound = NA)
feature.gr$label[lengths(symbols) == 1] <- unlist(symbols[lengths(symbols) == 1])
feature.gr$col <- sample(1:7, length(feature.gr), replace = TRUE)
feature.gr$type <- sample(c("cRE", "gene"),
  length(feature.gr),
  replace = TRUE,
  prob = c(0.1, 0.9)
)
feature.gr$pch <- rep(NA, length(feature.gr))
feature.gr$pch[feature.gr$type == "cRE"] <- 11
loopBouquetPlot(gi, range, feature.gr)