This function will convert the interactions scores into a distance matrix and then plot the matrix by multi-dimensional scaling plot.
mdsPlot(
  gi,
  range,
  feature.gr,
  k = 2,
  genomicSigs,
  signalTransformFun = function(x) {
     log2(x + 1)
 },
  lwd.backbone = 2,
  col.backbone = "gray",
  lwd.maxGenomicSigs = 8,
  reverseGenomicSigs = TRUE,
  col.backbone_background = if (k == 2) "gray70" else c("white", "darkred"),
  alpha.backbone_background = 0.5,
  lwd.gene = 3,
  coor_mark_interval = 5e+05,
  col.coor = "black",
  show_coor = TRUE,
  coor_tick_unit = 50000,
  label_gene = TRUE,
  col.tension_line = "black",
  lwd.tension_line = 1,
  length.arrow = NULL,
  safe_text_force = 3,
  square = TRUE,
  renderer = c("rgl", "threejs", "none", "granges"),
  ...
)
Arguments
- gi
An object of GInteractions
- range
The region to plot. an object of GRanges
- feature.gr
The annotation features to be added. An object of GRanges.
- k
The dimension of plot. 2: 2d, 3: 3d.
- genomicSigs
The genomic signals. An object of GRanges with scores or an object of track.
- signalTransformFun
The transformation function for genomic signals.
- lwd.backbone, lwd.gene, lwd.tension_line, lwd.maxGenomicSigs
Line width for the linker, gene, interaction node circle, the dashed line of interaction edges, the tension line and the maximal reversed genomic signal.
- col.backbone, col.backbone_background, col.tension_line, col.coor
Color for the DNA chain, the compact DNA chain, the node circle, the linker, the tension line and the coordinates marker.
- reverseGenomicSigs
Plot the genomic signals in reverse values.
- alpha.backbone_background
Alpha channel for transparency of backbone background.
- coor_mark_interval
The coordinates marker interval. Numeric(1). Set to 0 to turn it off. The default value 1e5 means show coordinates every 0.1M bp.
- show_coor
Plot ticks in the line to show the DNA compact tension.
- coor_tick_unit
The bps for every ticks. Default is 1K.
- label_gene
Show gene symbol or not.
- length.arrow
Length of the edges of the arrow head (in inches).
- safe_text_force
The loops to avoid the text overlapping.
- square
A logical value that controls whether control points for the curve are created city-block fashion or obliquely. See grid.curve.
- renderer
The renderer of the 3D plots. Could be rgl or threejs. The threejs will create a htmlwidgets. If 'none' is set, a list of object will be returned. If 'granges' is set, A GRanges with coordinates will be returned.
- ...
Parameter will be passed to isoMDS.
Value
Coordinates for 2d or 3d.
Examples
library(InteractionSet)
gi <- readRDS(system.file("extdata", "nij.chr6.51120000.53200000.gi.rds",
package = "geomeTriD"
))
range <- GRanges("chr6", IRanges(51120000, 53200000))
library(TxDb.Hsapiens.UCSC.hg19.knownGene)
library(org.Hs.eg.db)
feature.gr <- genes(TxDb.Hsapiens.UCSC.hg19.knownGene)
#> 24 genes were dropped because they have exons located on both strands of the
#> same reference sequence or on more than one reference sequence, so cannot be
#> represented by a single genomic range.
#> Use 'single.strand.genes.only=FALSE' to get all the genes in a GRangesList
#> object, or use suppressMessages() to suppress this message.
feature.gr <- subsetByOverlaps(feature.gr, range(regions(gi)))
symbols <- mget(feature.gr$gene_id, org.Hs.egSYMBOL, ifnotfound = NA)
feature.gr$label[lengths(symbols) == 1] <- unlist(symbols[lengths(symbols) == 1])
feature.gr$col <- sample(1:7, length(feature.gr), replace = TRUE)
feature.gr$type <- sample(c("cRE", "gene"),
length(feature.gr),
replace = TRUE,
prob = c(0.1, 0.9)
)
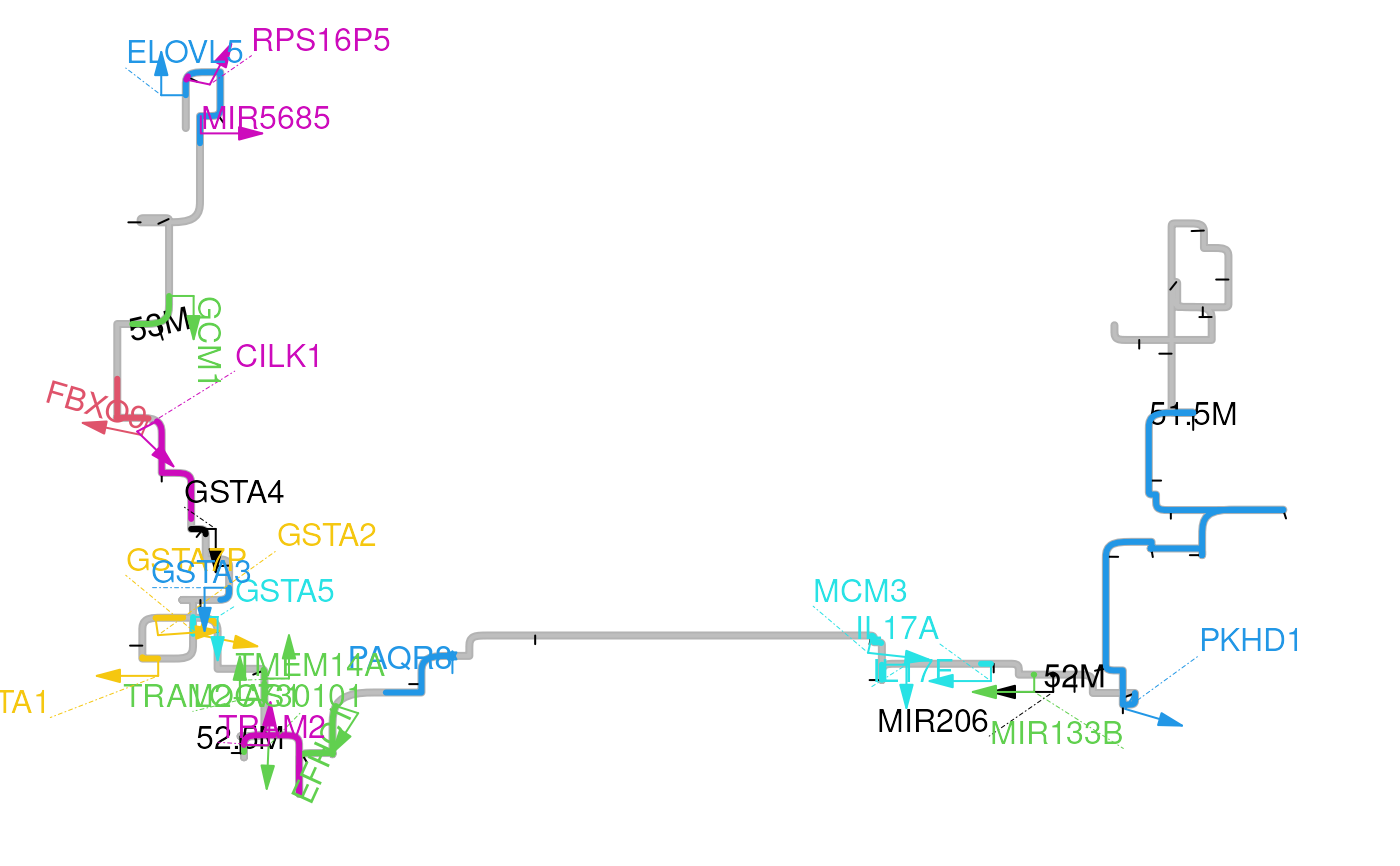
mdsPlot(gi, range, feature.gr)
#> Some region are missing from the input gi.
#> initial value 47.142211
#> iter 5 value 23.111945
#> iter 10 value 17.051591
#> iter 15 value 15.395783
#> iter 20 value 13.326562
#> iter 25 value 11.754067
#> iter 30 value 11.139277
#> iter 35 value 10.827596
#> iter 40 value 10.492219
#> final value 10.400890
#> converged