plot sequence logo
plotMotifLogo.Rdplot amino acid or DNA sequence logo
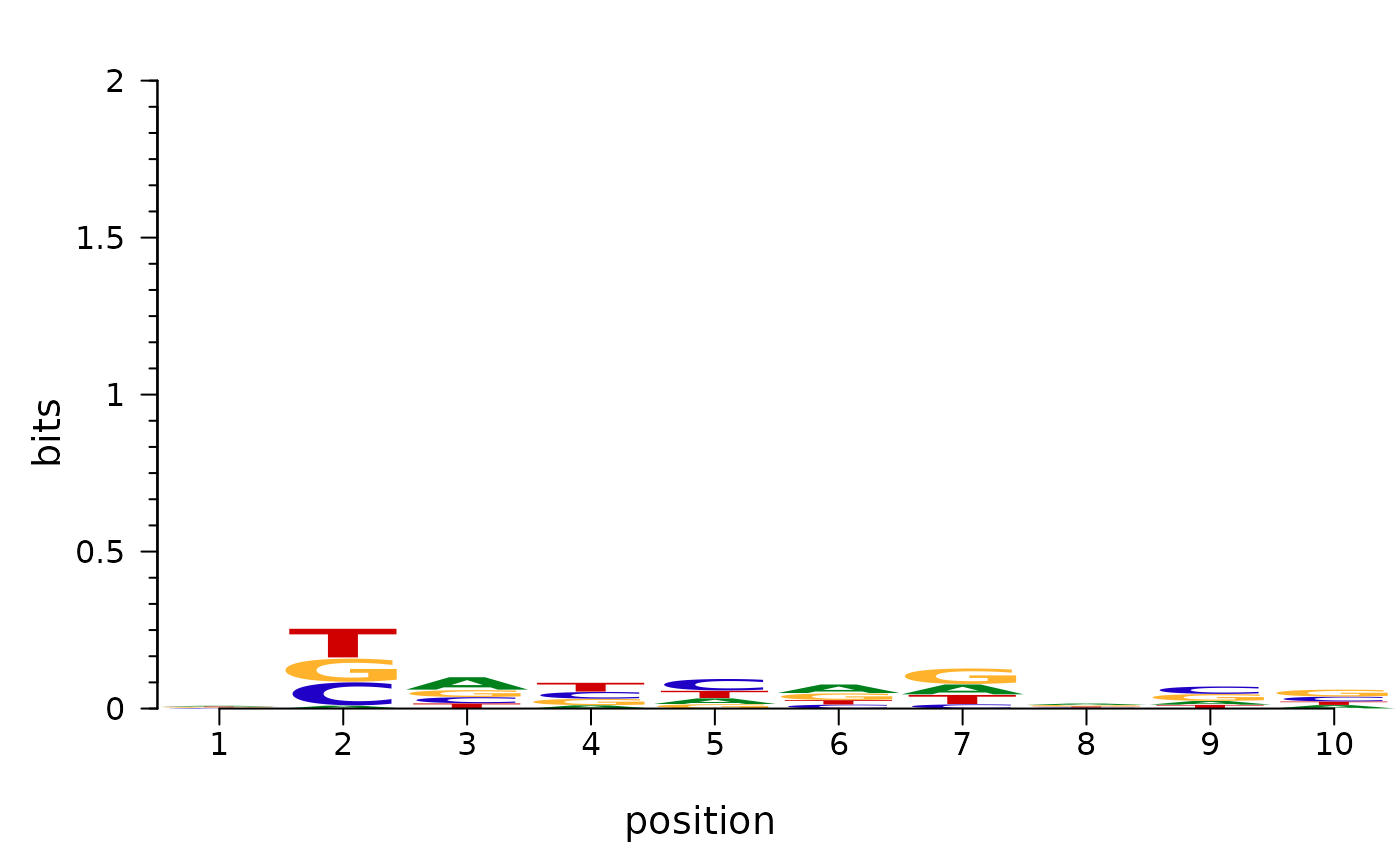
plotMotifLogo(
  pfm,
  motifName,
  p = rep(0.25, 4),
  font = "Helvetica-Bold",
  fontface = "bold",
  colset = c("#00811B", "#2000C7", "#FFB32C", "#D00001"),
  xaxis = TRUE,
  yaxis = TRUE,
  xlab = "position",
  ylab = "bits",
  xlcex = 1.2,
  ylcex = 1.2,
  ncex = 1.2,
  ic.scale = TRUE,
  newpage = TRUE,
  margins = c(4.1, 4.1, 2.1, 0.1),
  draw = TRUE
)
Arguments
| pfm | a position frequency matrices |
|---|---|
| motifName | motif name |
| p | background possibility |
| font | font of logo |
| fontface | fontface of logo |
| colset | color setting for each logo letter |
| xaxis | draw x-axis or not |
| yaxis | draw y-axis or not |
| xlab | x-label, do nothing if set xlab as NA |
| ylab | y-label, do nothing if set ylab as NA |
| xlcex | cex value for x-label |
| ylcex | cex value for y-label |
| ncex | cex value for motif name |
| ic.scale | logical If TRUE, the height of each column is proportional to its information content. Otherwise, all columns have the same height. |
| newpage | logical If TRUE, plot it in a new page. |
| margins | A numeric vector interpreted in the same way as par(mar) in base graphics. |
| draw | Vector (logical(1)). TRUE to plot. FALSE, return a gList |
Value
none
Examples
pcm<-matrix(runif(40,0,100),nrow=4,ncol=10)
pfm<-pcm2pfm(pcm)
rownames(pfm)<-c("A","C","G","T")
plotMotifLogo(pfm)