Introduction
This document describes the output produced by the pipeline. Most of the plots are taken from the MultiQC report, which summarises results at the end of the pipeline.
The directories listed below will be created in the results directory after the pipeline has finished. All paths are relative to the top-level results directory.
Pipeline overview
The pipeline is built using Nextflow and processes data using the following steps:
- trimmomatic - Remove primers
fastq_pair_filter.py- Sync barcodesqiime2::demux- Demultiplex- DATA2 - Filter reads and run DATA2
- FastQC - Raw read QC
- MultiQC - Aggregate report describing results and QC from the whole pipeline
- Pipeline information - Report metrics generated during the workflow execution
Remove primers
Output files
1_remove_primers/ *.fastq.gz: Zip archive containing primer removed fastq files.
Removing primers from Illumina data (Paired-End Fastq) using trimmomatic.
This step is recommended by dada2 in their FAQ on chimera checking.
Sync barcodes
Output files
2_sync_barcodes/ *.fastq.gz: Zip archive containing proper paired fastq files.
Make sure forward, reverse, and index read files are all aligned (i.e. line 1 of each corresponds to each other) using fastq_pair_filter.py.
Demultiplex
Output files
3_demultiplex/demuxd_reads/ *.fastq.gz: Zip archive containing demultiplexed fastq files.3_demultiplex/ *.qza: Qza archive containing qiime2 files.
Break fastq files (F and R) into individual samples based on barcodes using qiime2::demux.
Filter reads and run DATA2
Output files
4_filter/<sampleid>/ *.fastq.gz: Zip archive containing filtered fastq files.4_filter/ *.png: QC plots.4_filter/ *.rds: R object from DATA2 for downstream analysis.{5_dada2,6_phyloseq}/*.csv: QC stats from DATA2 for downstream analysis.{5_dada2,6_phyloseq}/*.txt: DATA2 and phyloseq running logs.{7_Krona}/*.html: Interactive metagenomic visualization by KronaTools.
This step merges paired reads, constructs a sequence table, and assigns taxonomy using the silva database. The output is a phyloseq object, as well as the sequence table and taxonomy table.
FastQC
Output files
fastqc/*_fastqc.html: FastQC report containing quality metrics.*_fastqc.zip: Zip archive containing the FastQC report, tab-delimited data file and plot images.
FastQC gives general quality metrics about your sequenced reads. It provides information about the quality score distribution across your reads, per base sequence content (%A/T/G/C), adapter contamination and overrepresented sequences. For further reading and documentation see the FastQC help pages.
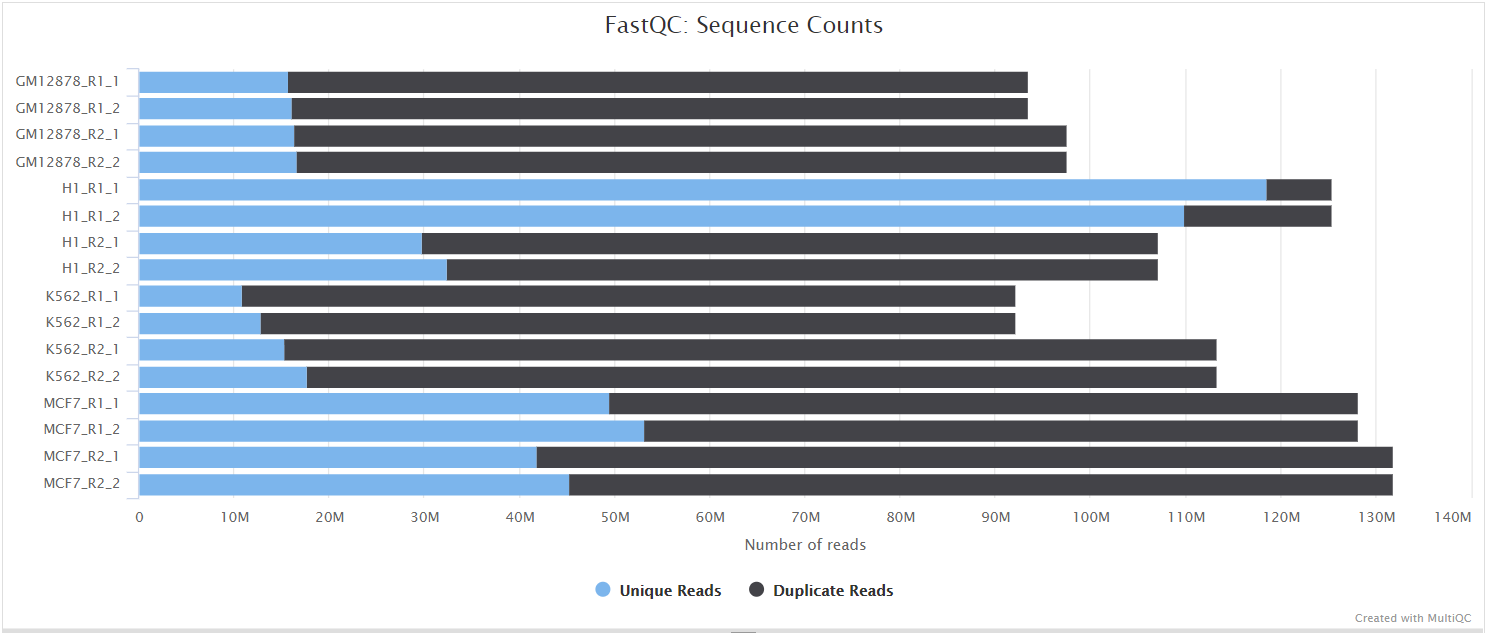
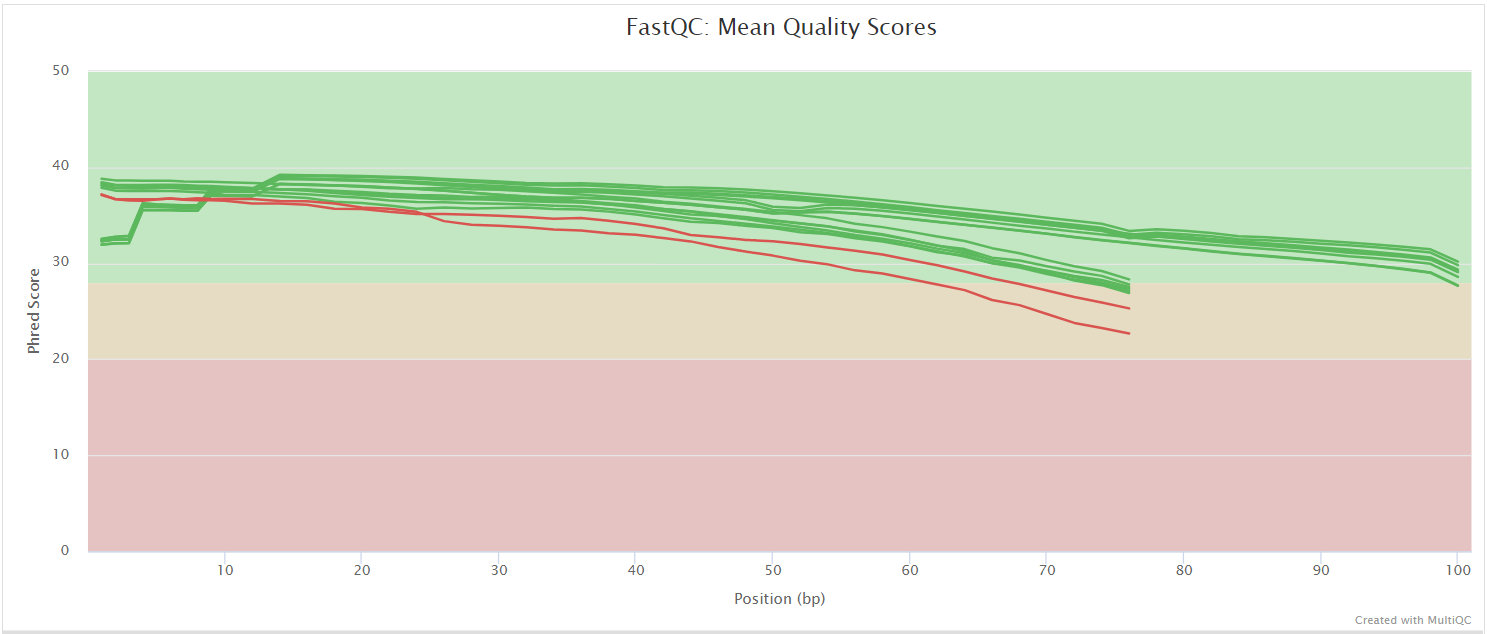
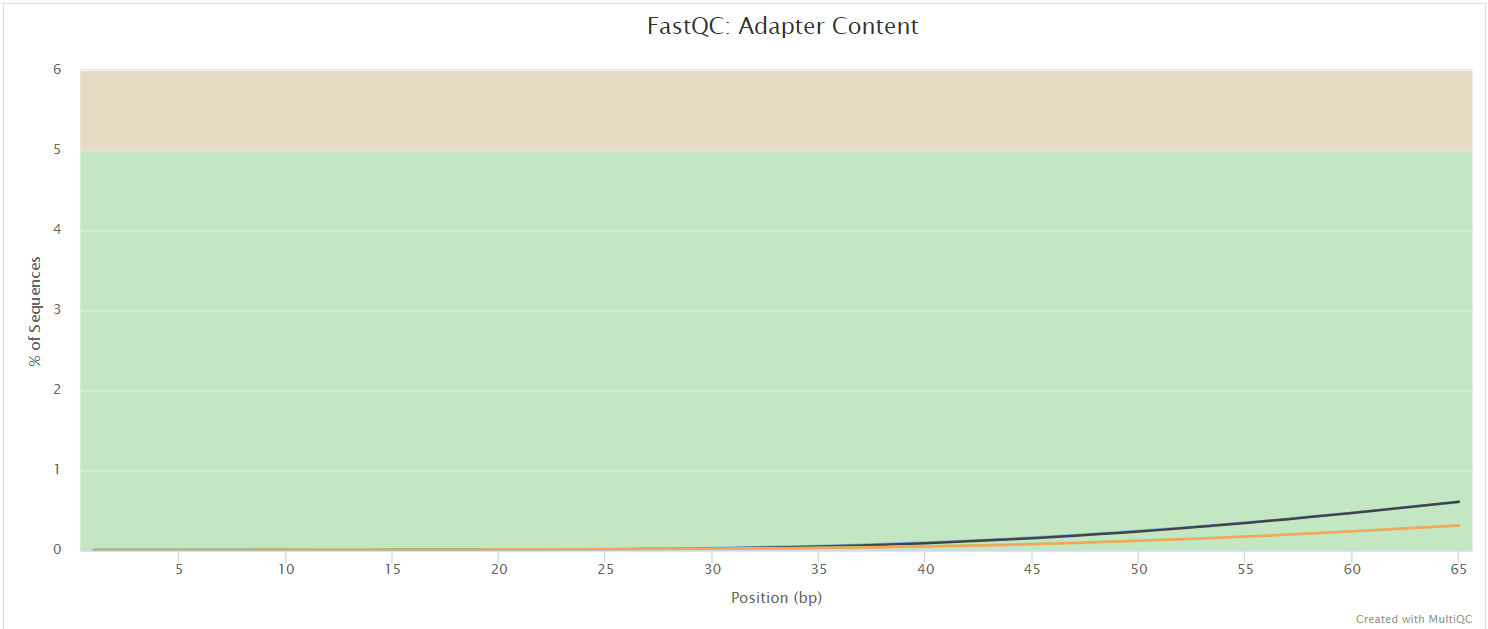
NB: The FastQC plots displayed in the MultiQC report shows untrimmed reads. They may contain adapter sequence and potentially regions with low quality.
MultiQC
Output files
multiqc/multiqc_report.html: a standalone HTML file that can be viewed in your web browser.multiqc_data/: directory containing parsed statistics from the different tools used in the pipeline.multiqc_plots/: directory containing static images from the report in various formats.
MultiQC is a visualization tool that generates a single HTML report summarising all samples in your project. Most of the pipeline QC results are visualised in the report and further statistics are available in the report data directory.
Results generated by MultiQC collate pipeline QC from supported tools e.g. FastQC. The pipeline has special steps which also allow the software versions to be reported in the MultiQC output for future traceability. For more information about how to use MultiQC reports, see http://multiqc.info.
Pipeline information
Output files
pipeline_info/- Reports generated by Nextflow:
execution_report.html,execution_timeline.html,execution_trace.txtandpipeline_dag.dot/pipeline_dag.svg. - Reports generated by the pipeline:
pipeline_report.html,pipeline_report.txtandsoftware_versions.yml. Thepipeline_report*files will only be present if the--email/--email_on_failparameter's are used when running the pipeline. - Reformatted samplesheet files used as input to the pipeline:
samplesheet.valid.csv.
- Reports generated by Nextflow:
Nextflow provides excellent functionality for generating various reports relevant to the running and execution of the pipeline. This will allow you to troubleshoot errors with the running of the pipeline, and also provide you with other information such as launch commands, run times and resource usage.