Add annotation markers to the figure at a given position
addInteractionAnnotation.RdA function to add annotation markers for emphasizing interactions
addInteractionAnnotation(
  obj,
  idx,
  FUN = grid.polygon,
  panel = c("top", "bottom"),
  ...
)
Arguments
- obj
A GInteractions object, GRanges object or numeric vector. For numeric vector, the positive value will generate a line with slope 1 and negative value will generate a line at the position with slope -1.
- idx
The layer number of track.
- FUN
Function for plot. Available functions are grid.polygon, grid.lines, and grid.text for GInteractions object; grid.lines, and grid.text for GRanges object; FUN is not used for numeric vector.
- panel
Plot regions. Available values are "top", "bottom".
- ...
Parameters will be passed to FUN.
Value
invisible viewport for plot region.
See also
See Also as addGuideLine, addArrowMark
Examples
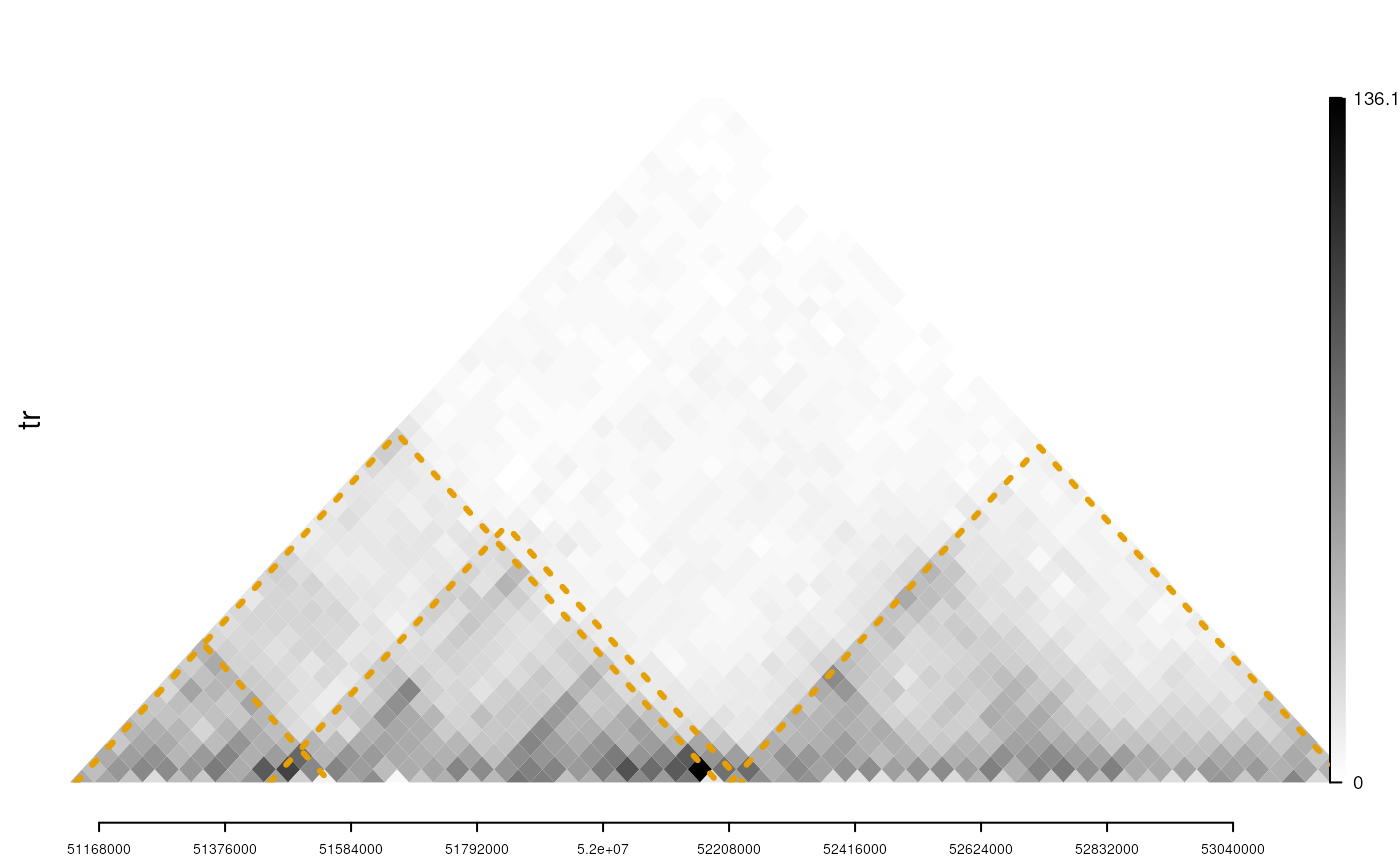
library(trackViewer)
library(InteractionSet)
gi <- readRDS(system.file("extdata", "nij.chr6.51120000.53200000.gi.rds",
 package="trackViewer"))
tads <- GInteractions(
GRanges("chr6",
        IRanges(c(51130001, 51130001, 51450001, 52210001), width = 20000)),
GRanges("chr6",
        IRanges(c(51530001, 52170001, 52210001, 53210001), width = 20000)))
range <- GRanges("chr6", IRanges(51120000, 53200000))
tr <- gi2track(gi)
viewTracks(trackList(tr),
           gr=range, autoOptimizeStyle = TRUE)
addInteractionAnnotation(tads, "tr", grid.lines,
 gp=gpar(col = "#E69F00", lwd=3, lty=3))